
03Data Visualization2026Solo — data engine, GPU renderer, interface, tests
Strata — Crossfilter over Millions of Rows
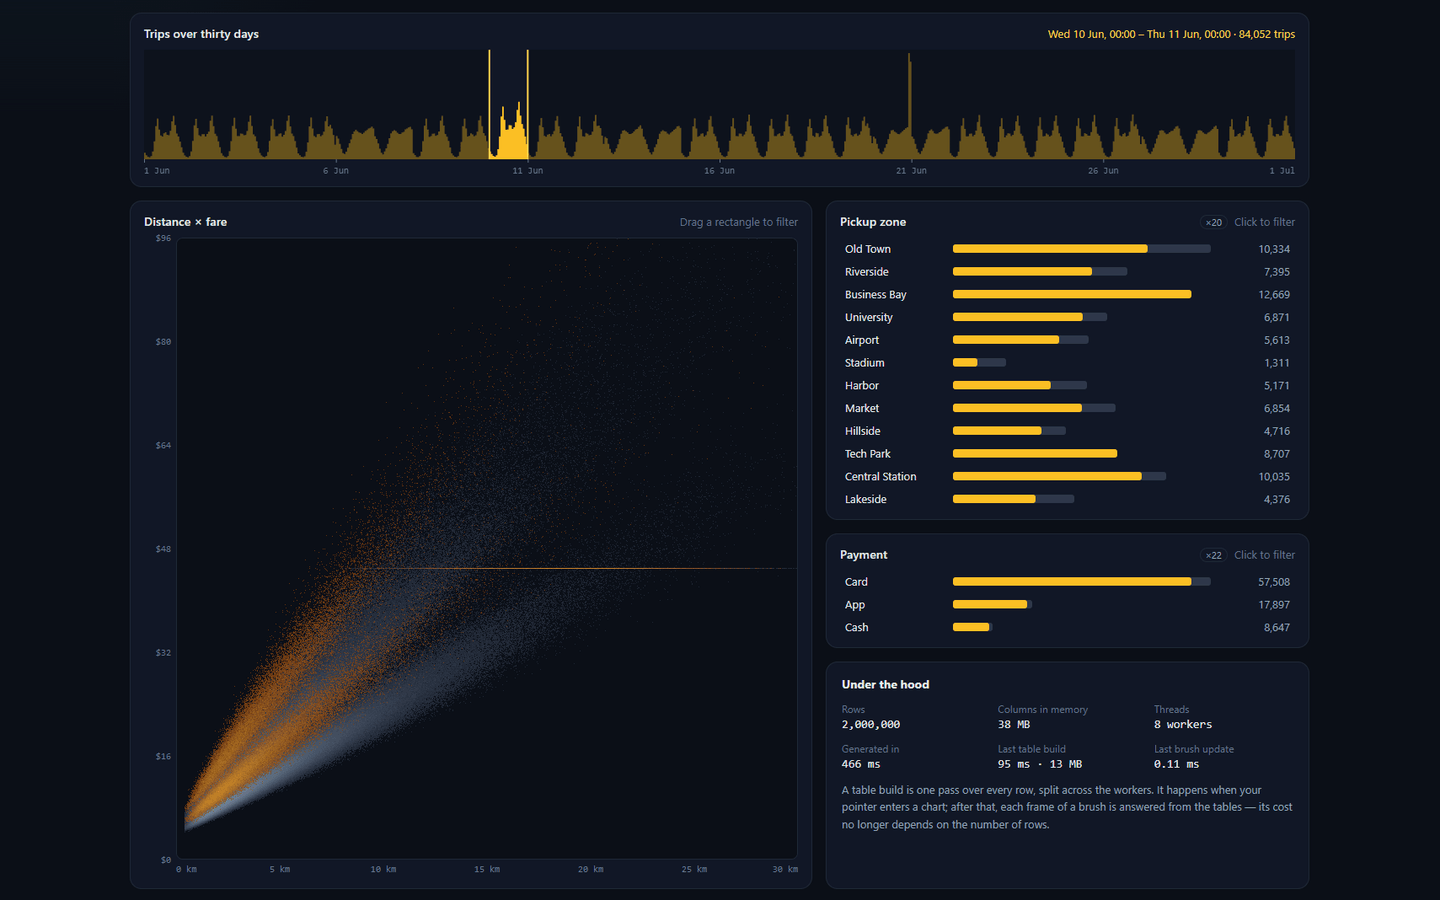
Linked charts over up to ten million rows, all in the browser: brush any chart and every other one follows within the frame.
The problem
Linked charts, where brushing one filters the rest, are easy with a few thousand rows and a server to ask. I wanted to see how far a browser can take them alone, with every row in memory, every chart linked to every other, each frame of a drag answered within the frame, and a static host. The answer was ten million rows. Memory, aggregation, rendering and the tests each had to be built for that size.
Decisions
01
Columns in memory every worker shares
Ten million trips as JavaScript objects would take gigabytes and keep the garbage collector busy. As seven typed-array columns they take 19 bytes a row, held in SharedArrayBuffers that a pool of workers generates and scans in place, with nothing copied between threads. Shared memory needs a cross-origin isolated page, so the host sends the COOP and COEP headers. Without them the page still works, on one thread.
02
A brush is a lookup, not a scan
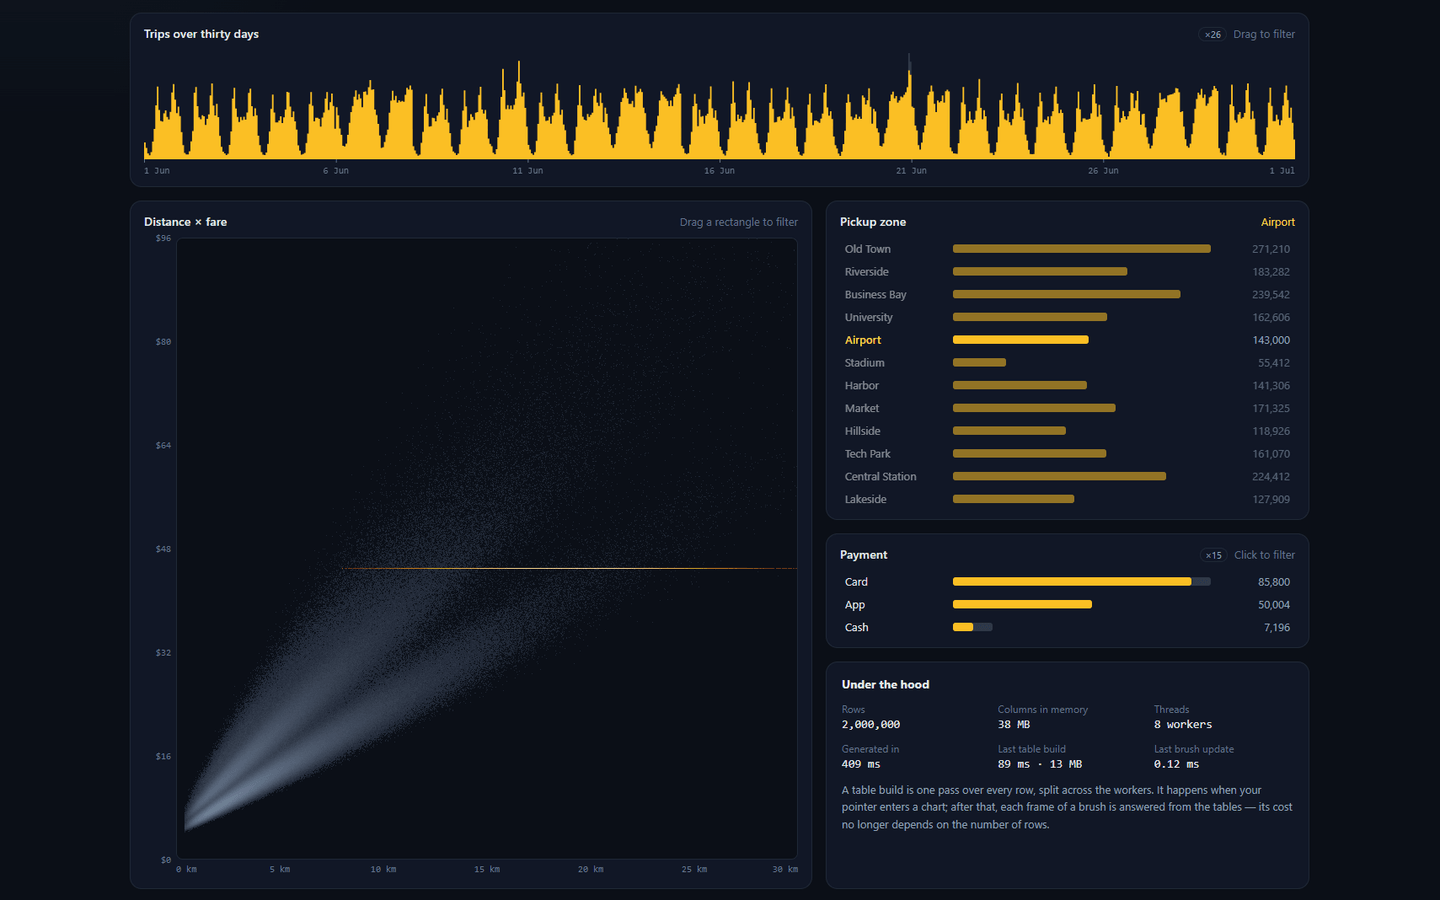
Rescanning every row on every frame of a drag cannot keep up at this size. I followed Falcon (Moritz, Howe and Heer, CHI 2019). When the pointer enters a chart, one pass counts rows by bin of that chart × bin of each other chart, and the counts become prefix sums, or summed-area tables for the scatter plot's rectangle. After that a frame costs about 0.02 ms, whether there are one million rows or ten. The pass itself runs while the pointer is still on its way.
03
The GPU re-filters every point during a drag
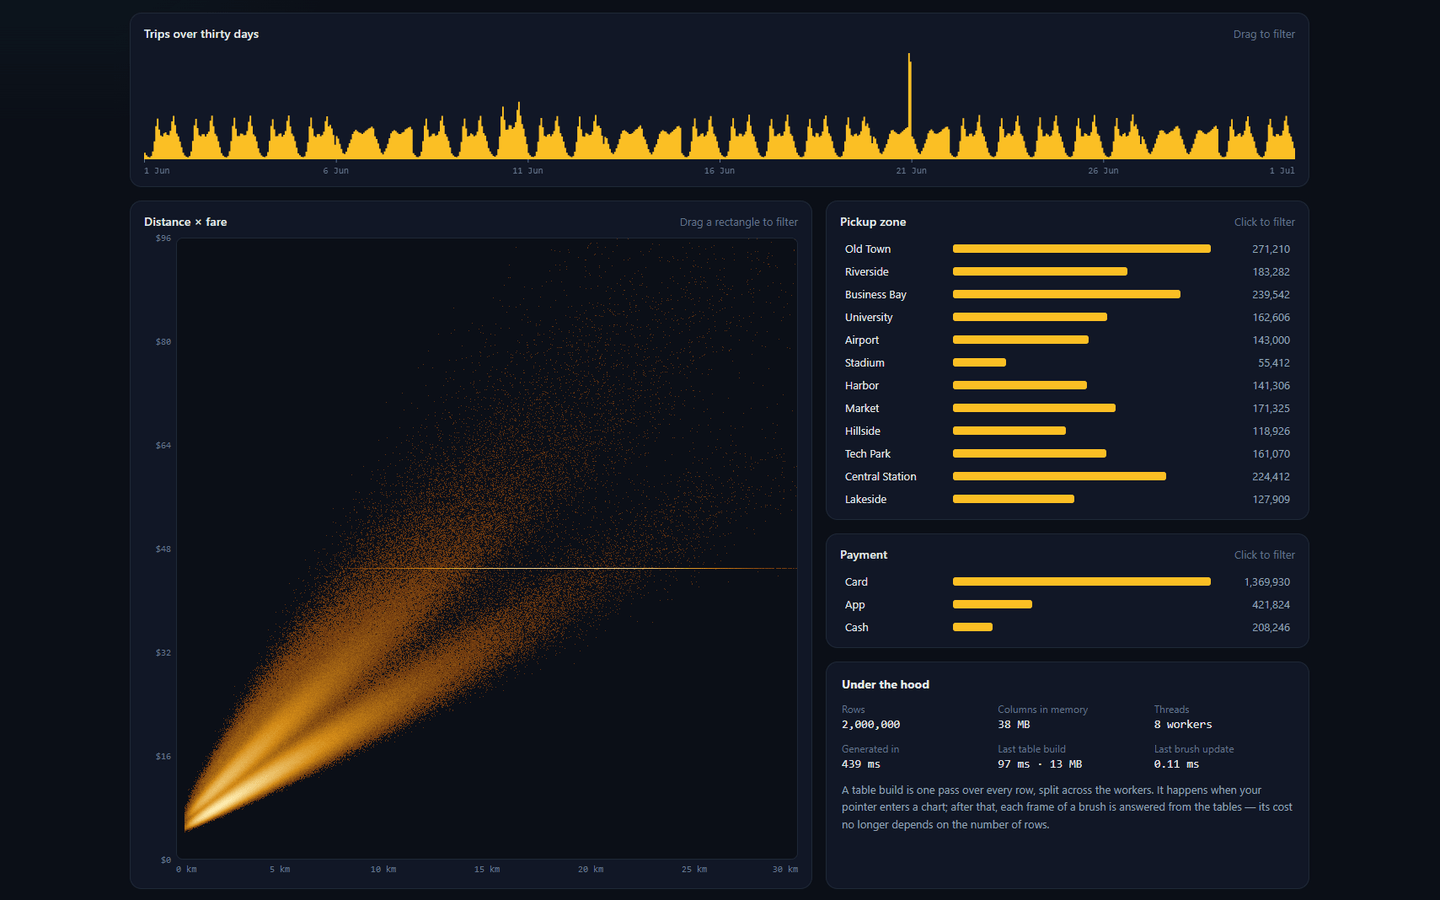
Positions go to the GPU once. The workers write one byte per row, which says whether the row passes every filter except the one being brushed. The live brush reaches the shader as a few uniforms. So a drag on another chart uploads nothing, and every point is tested again on every frame.
04
Counted, not painted
The first version blended points straight onto the screen, and every dense area burned out to the same white, because an 8-bit channel is full after a few hundred points. Now each point adds one to its pixel in a float texture. The GPU finds the maximum by shrinking that texture 4 × 4 at a time, and a last pass colours each pixel by the log of its count. The plot also had stripes. Fares rounded to ten cents landed 0.77 px apart, and rounding to the cent fixed it.
05
Tests that count everything again
The generator is seeded per chunk, so the data comes out the same however many workers produce it. The end-to-end tests regenerate it in Node and compare the page's number with a plain loop over every row. That covers the stories, keyboard brushing, category toggles and pointer drags. The filters live in the URL, which makes every view a shareable link and lets the tests read back exactly what a drag selected.
06
A fair comparison with SVG
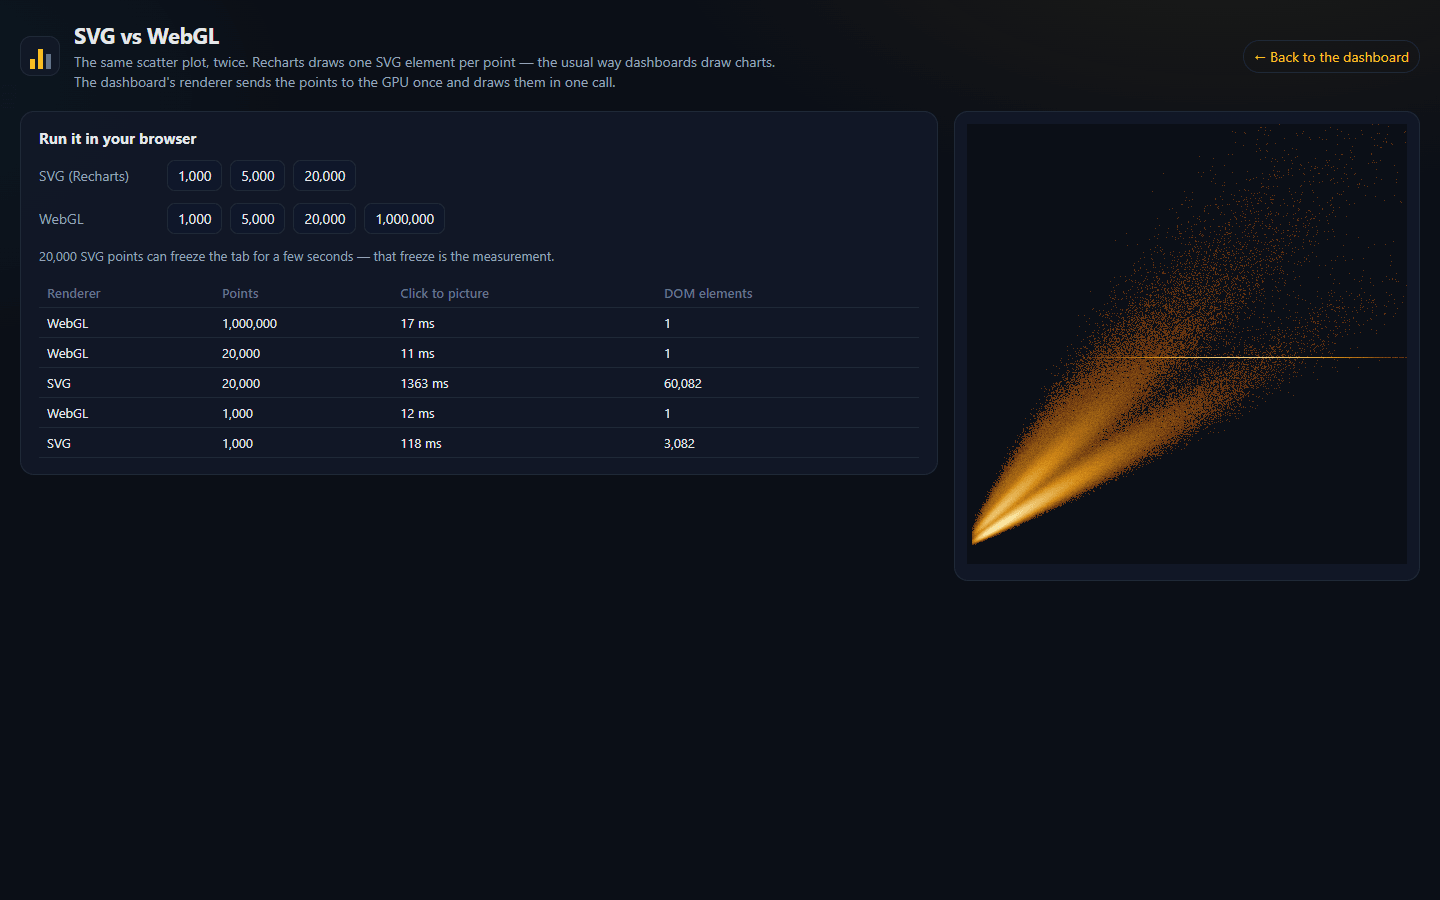
A second page times Recharts, which draws one SVG element per point, against the WebGL renderer, in the visitor's own browser. Its first numbers were unfair to WebGL. A run straight after a big SVG chart also paid for the browser collecting those 60,000 nodes, and measured 400 ms instead of 12. Runs now start once that cleanup is over.
What I measured
10M
rows in the browser
generated in about a second on eight workers
0.02 ms
per brush frame
the same at one million rows and at ten
12 ms
20,000 points in WebGL
Recharts SVG: 1.4–2 s and 60,082 elements
17 + 7
unit + end-to-end tests
every end-to-end count is checked against a brute-force scan
Built with
- React
- TypeScript
- Web Workers
- WebGL2
- Cloudflare Workers